


Putting Biodiversity on the Map
Real-time actionable biodiversity insights at everyone's fingertips.
Real-time actionable biodiversity insights at everyone's fingertips.
Real-time actionable biodiversity insights at everyone's fingertips.

Supported by:

Winners of:

Research by:

Supported by:
Winners of:
Research by:
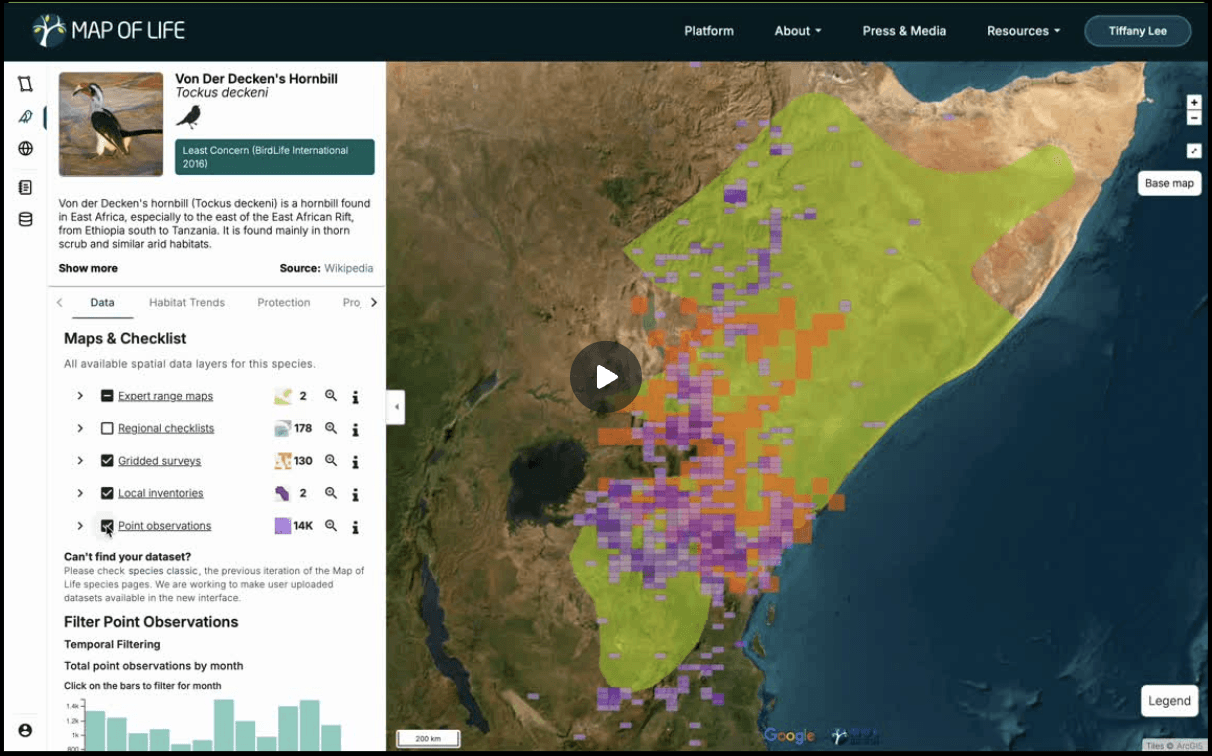
Navigate ecological impact with the world’s most comprehensive biodiversity map.

Core
Core
Core
Free & Accessible
Open global biodiversity indicators for scientific advancement, providing baseline data at global, country, and regional scales.
Including:
Expert-validated species range and distribution maps.
GBF-adopted indicators: SPI, SHI, and SII.
Annual habitat loss/gain tracking.
Alignment with CBD and SDGs.
Bi-annual global occurrence data (GBIF, eBird).
Standardized taxonomy for easy species management.
Watch demo
Pro (coming soon)
Tailored & Instant
Explore areas of interest directly and choose from a suite of metrics and visualizations designed to align with specific project types and goals.
Including:
All of Core
Interactive project portfolio tools.
Impact comparisons and predictions across sites.
Optimized nature investments.
Species insights on endangered, endemic, and rare species protection.
Local data ingestion for improved modeling.
Support for acoustics, camera traps, eDNA, UAVs, and traditional methods.
Alignment with biodiversity reporting frameworks (TNFD, STBN, CSRD).
Compatibility with carbon and biodiversity credit frameworks.
Impactful story generation.
Functionality segmentation across stakeholders.
APIs for data integration.

Designed for local project managers to CEOs
from local precision to global trends
Designed for local project managers to CEOs
from local precision to global trends
PORTFOLIO
REGIONAL
LOCAL
PORTFOLIO
REGIONAL
LOCAL
PORTFOLIO
REGIONAL
LOCAL
PORTFOLIO
REGIONAL
LOCAL
Sectors served
Governments
NGOs
Research Institutions
Governments
NGOs
Research Institutions
Corporations
Project Developers
Integrators and Licensees
Corporations
Project Developers
Integrators & Licensees
Decrease costs by making use of what's already available. We'll identify gaps and the most efficient methods of data gathering to fill them.
Designed to
inform action across stakeholder levels
funnel into compliance frameworks
generate compelling stories of positive decision-making and change
Sectors served


Just a few of our supporting partnerships…